Queensland Globe and the rise of the citizen-user
Jul 20, 2017 22:04 · 1820 words · 9 minutes read
I have been captivated by the work of Benjamin Bratton especially his notion of a citizen-user (p. 10). Bratton sees users as a layer of an accidental mega-structure he calls the Stack. The Stack is a new geopolitical totality born from planetary scale computing (cf. Sterling). His work tries to make sense of what Facebook, Google, Amazon mean to the world, to politics, to jurisdictions, to the city, and the Earth. While I’m inspired by his work, I want to focus in on his idea of the citizen-user and what this new category means for territorially bound jurisdictions like nation-states.
Rather than see boundary trangressing users as a threat to their populations, states are moving in on the new terrain of the Stack and enticing users back to their services. The case that I think through here is a recent project I worked on called the Queensland Globe where users can share and play with the curated spatial geometries of the state. The project was a replacement for Google Earth because Google abandoned its enterprise mapping product (now open source). Here, I tell a story of the rise of the user and what this means for governments and the maps they make. The tale starts with rebels in the Scottish Highlands, then follows the decline and fall of Google Earth Enterprise, and ends with some Queenslanders exchanging maps. I then conclude with what I predict the next challenges will be for states taking up a home on the Stack.
In one sense a citizen is easily defined. You’re born somewhere and that place defines your citizenship. Over the last four centuries this place has been the political unit we know as the sovereign nation state. The seminal moment for these political units were the treaties of Westphalia in the late seventieth century. The treaties laid out a new way of carving up the world whereby each unit would respect the sovereignty of its neighbour. No sovereignty could overlay another. This way of carving up the world is still with us. The idea of sovereignty meant also that the Westphalian world view ruled out any hierarchy of nations. No encompassing regions, no sovereignties within sovereignties. So too was the citizen born as populations came to be defined by the scheme. There could be no citizen belonging to two territories. This single lateral view has relevance still. Playing out in the news right now is the resignation of two greens senators from the Australian Parliament because of their dual-citizenship (dual-citizenship makes you ineligible to be a Federal politician). Exceptions like this say alot about the explanatory limitations of the Westphalian scheme especially in light of other encompassing spatial orderings like region, commonwealth and empire (political geographies have probably always been hierarchical, maybe even Stack like).
However, populations within a jurisdiction aren’t always compliant citizens. The United Kingdom dealt with rebels and secessionists in a highly inventive way. The King sent out his engineers and they created a map of all the features of the Scottish Highlands so his military campaign strategists could crush a rebellion. The topographic map they created accounted for everything in the realm that was greater than a metre square in size. The United Kingdom’s Ordnance Survey was born. Topographic features were the geometries of war and the focus of the maps were features in the landscape that were useful to armies: stone fences, wells, buildings, fords, ridge lines and so on. In one sense, not much has changed with mapping and positioning technologies critical to maintaining air power; a new terrain occupied by states.
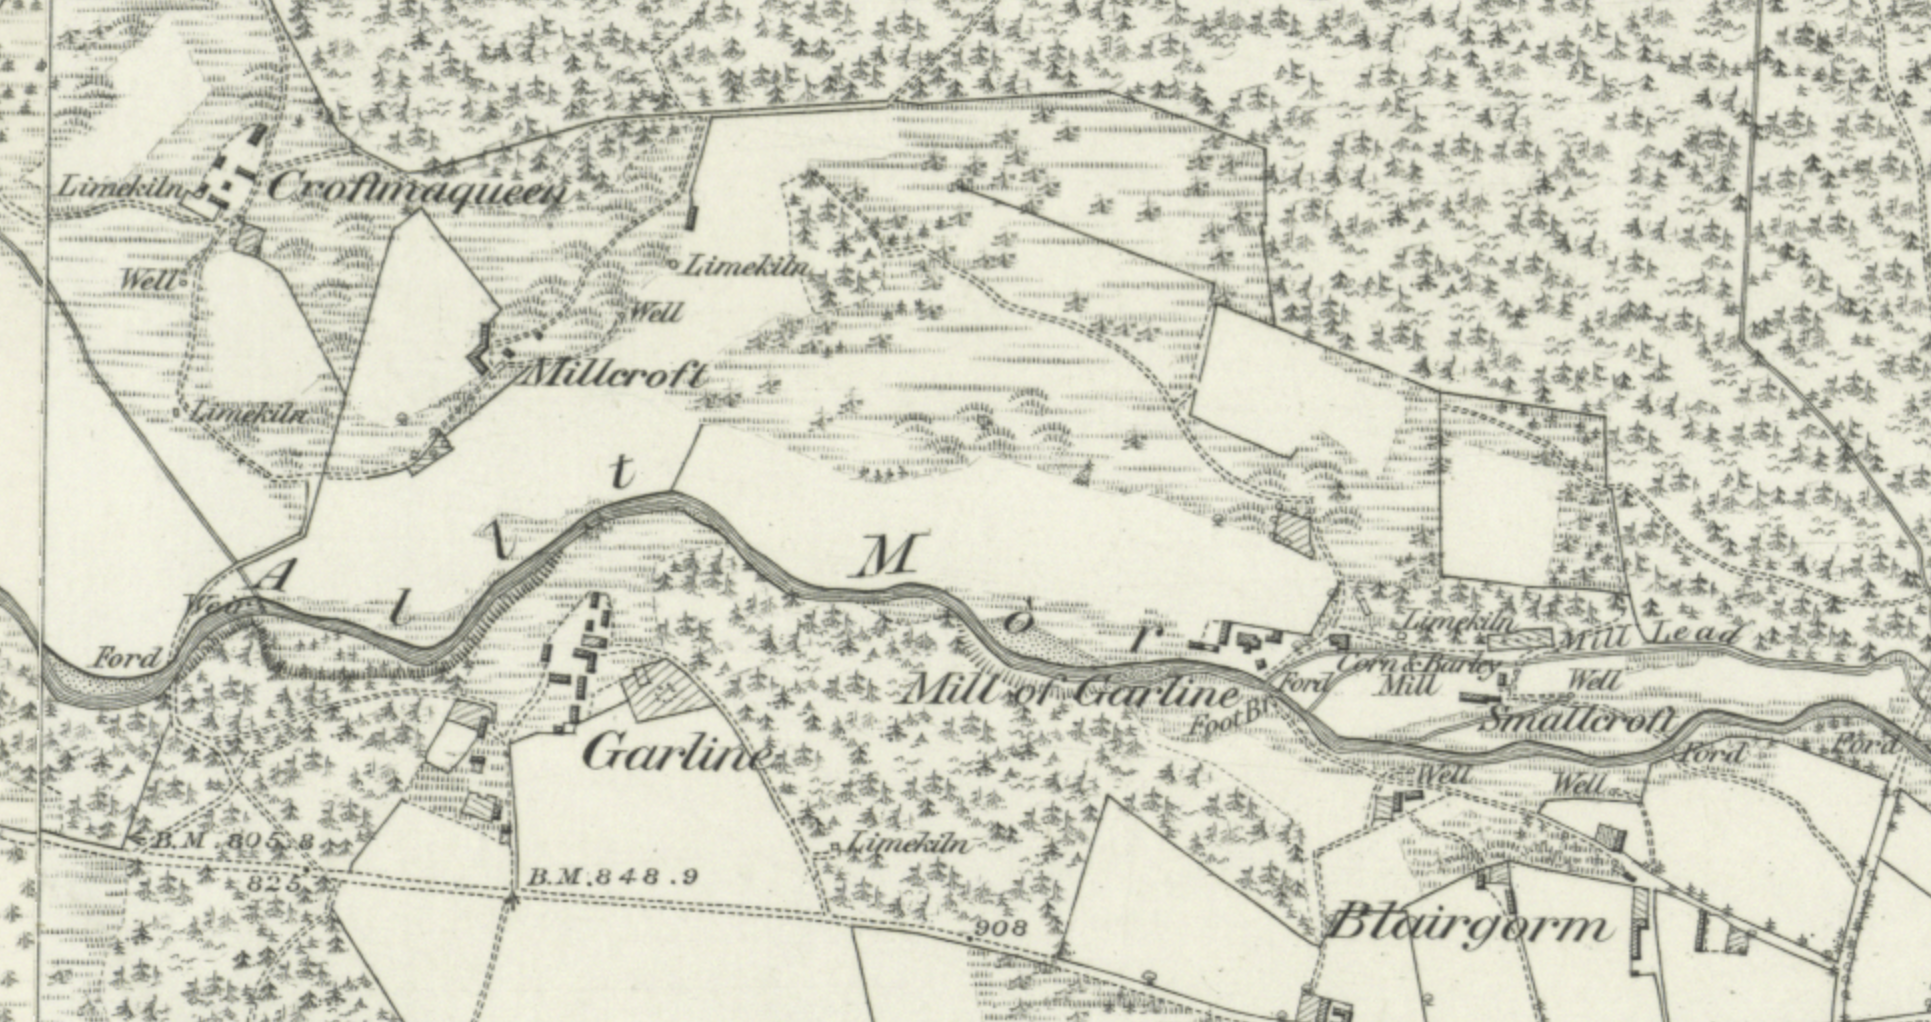
Ordnance Survey Maps - Six-inch 1st edition, Scotland, 1843-1882 (Source: National Library of Scotland).
The Ordnance Survey set the standard for the centuries to come. They began something that has now become a core function of governments; making topographical maps. With the advent of the computer and geographic information systems (GIS), the topographic map largely stayed the same, but now governments could scale up and overlay one map upon the other. The interactive mapping experience was born. The new concept in the move to computers was the idea of the layer, or overlay. Enter the user. A character defined by interfaces (humans bound by 414x73 6pixels and bots bound by REST apis). Users could stack one layer upon another, making comparisons between them. An ecologist, to take an example, might activate a layer of pasture coverage and then compare that layer to property boundaries and historical land use. The move to computers made mapping and cartography even more specialised. But this user was, and still is, a specialist, cloistered in a government department toggling layers.
With all these computers and layers and GIS users and geometries, governments started to amass considerable amounts of geographic data. So much data, but so few using it. One way to address this was to open up the data to the Public and encourage citizens to use it. This idea galvanized around the notion of open data but it soon became apparent, especially with spatial information, that the data was difficult for the Public to use. One foray into making open data useful was by Google, a company whose ideology of knowledge for all meshed well with the open data movement.
When Google Earth was released in the mid-naughties its take up spawned a new era in mapping. The Earth could be represented as a single spinning ball, wrapped in a seamless coating of satellite images. The use of photography in this way opened up interactive mapping to a new audience. Unlike topographical maps with their legends and symbols and contours to depict depth, the use of photographs as a map made it much easier for users to orientate themselves to the geography depicted. Changes in scale became as intuitive as the scroll of a mouse and as one scrolled-in the level of detail improved along with it. The point of view was the user’s to choose. Users were no longer trapped with north at the top of the page or a fixed scale decided by a cartographer. Google Earth quickly became the application of choice for field workers from ecologists to mining officers, anthropologists to desktop land valuers. Users could create geometries themselves as well and mark-up the map with their own information. Geometries started to fling around by email as users shared their places, my places, as KML files.
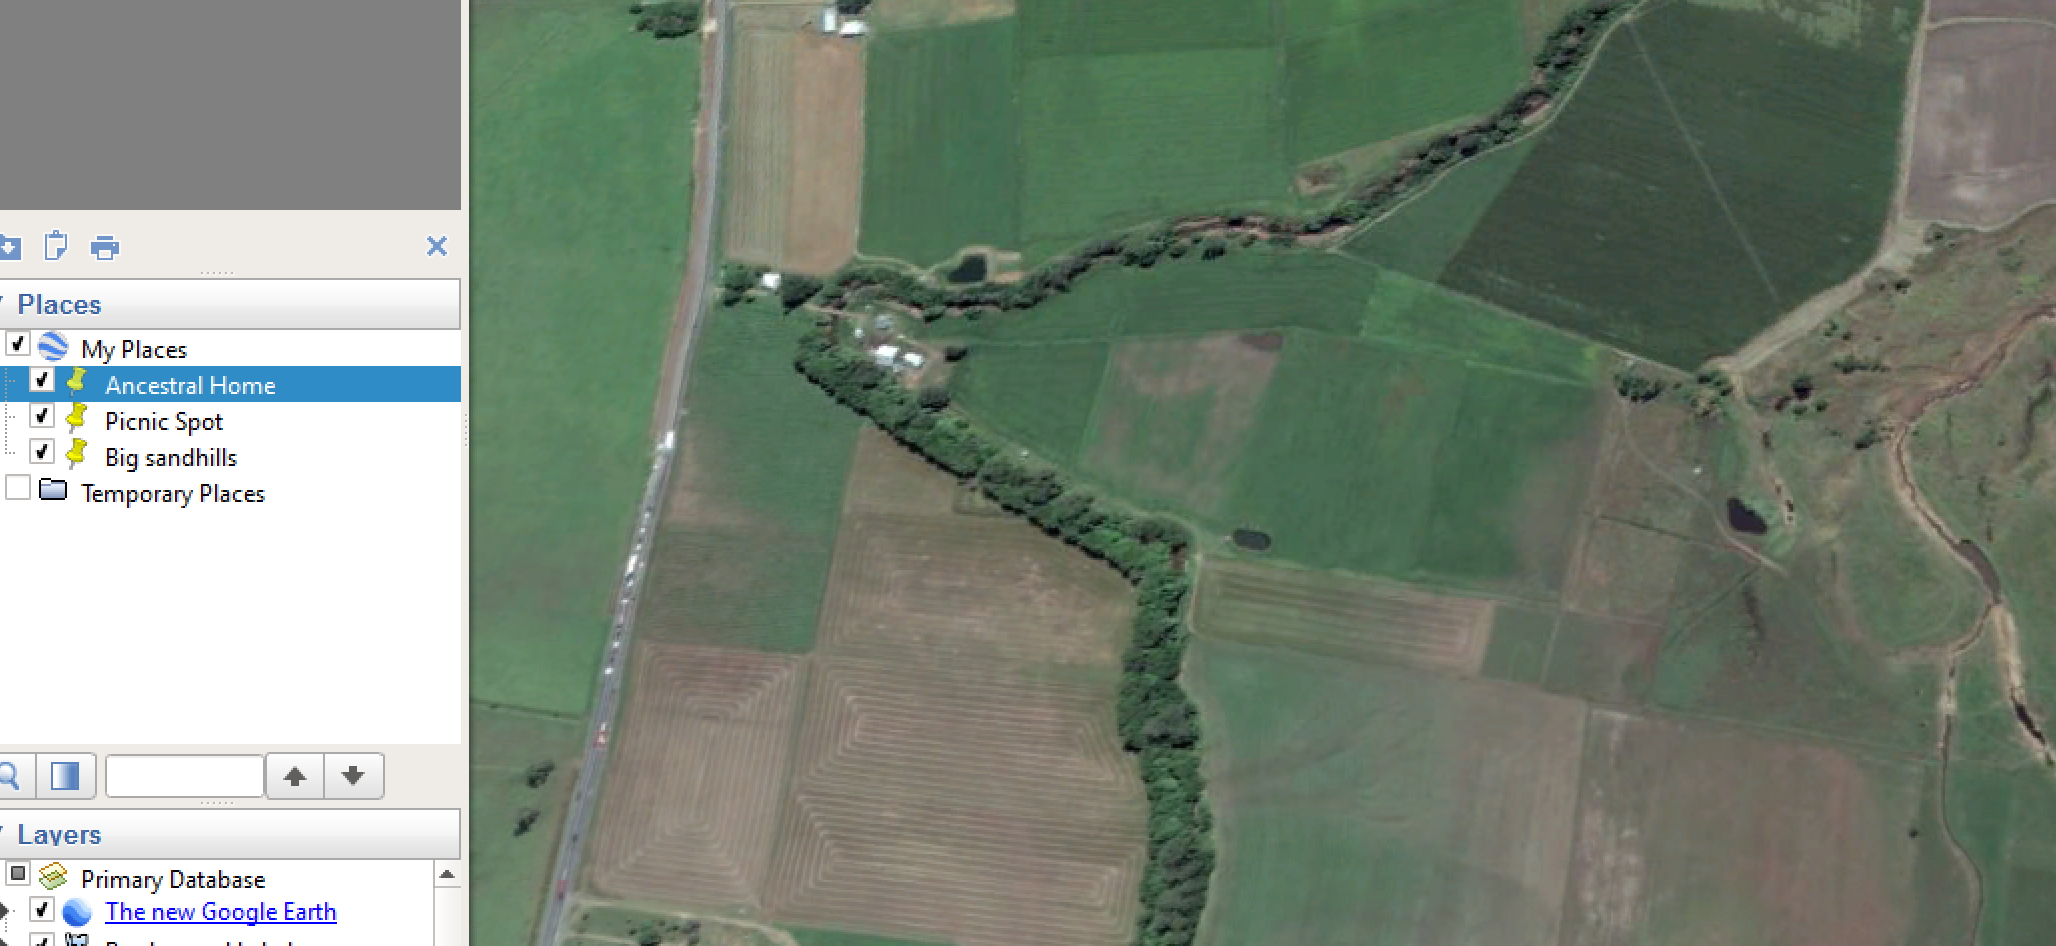
My Places panel in Google Earth Pro for Desktop (Screen capture from Google Earth Pro).
In “My Places” all your trips in the field, all your secret fishing spots, could be categorized and labeled and placed in folders of your choosing. It was in this folder that those topographical features, those geometries, became personal, and less a creation of government and instead, something specifically your own. One could advise a road crew about where to dig a borrow pit. Better still, the ease with which this was achieved led to a whole raft of people, outside of GIS, using spatial information.
On the back of the success of Google Earth, Google then decided to allow governments to mold their own earths. Google Earth Enterprise Server emerged with governments and large institutions in mind. The server edition gave governments the ability to create their own sets of imagery, layers, and data for their own users and have this information appear in the desktop application. Governments could have all the key functionality of Google’s Earth as their own Earth. The Queensland Government jumped right on in and built Globe 1.x using Google Earth Enterprise Server. It all went well but there were draw backs. Enterprise Server doesn’t know who you are. All the Queensland Government knew about its users were the raw statistics of Anonymous; billions of map tile requests from nowhere, by no-one. But a success for open data enthusiasts. Google had other ideas though. In 2015, they decided to cease support of Enterprise Server. No more earths within Google Earth. For good reason, it was a design flaw for Google. It clashed with the central premise of Google itself. Google services are not to be mediated by other territorial jurisdictions. Google services are designed with the Earth as its scale and the human race as its user-base (or livestock as Bruce Sterling calls us). Google didn’t sign the treaty of Westphalia. The server edition gave jurisdictions the chance to erect their own stockyards and corral Google’s livestock.
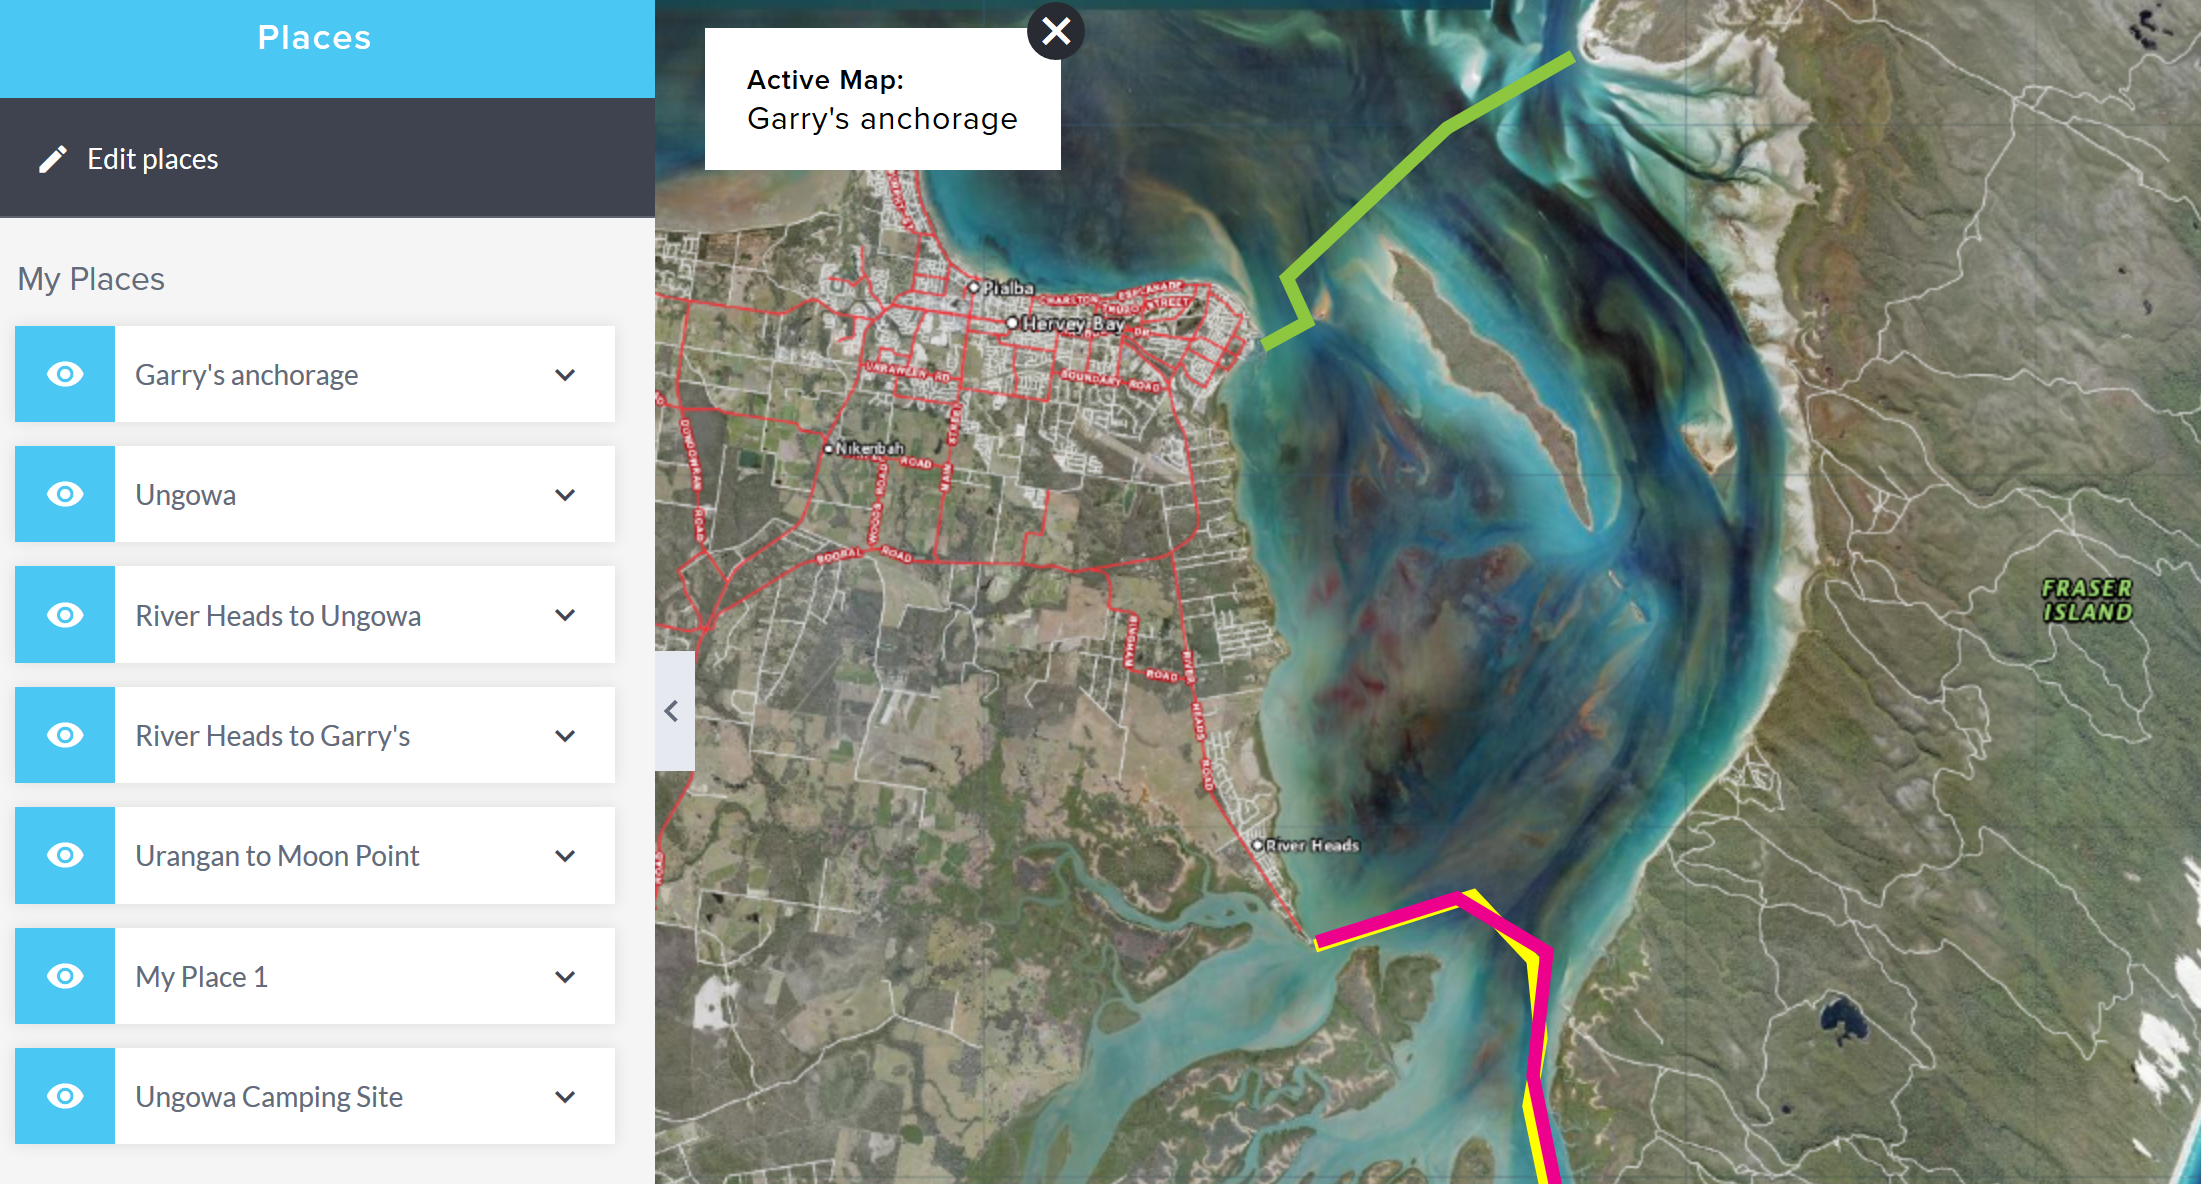
My Map and places around Fraser Island (Screen capture from Queensland Globe).
The end of GE Enterprise Server meant the Queensland Government had to scrabble. They had created a loyal following of anonymous users. The Queensland government responded with more software and called it Globe 2.x. First they accepted the need to be there for the livestock, but with an added twist. They decided to engage with users and encourage Facebook / Google / Twitter identities to come and play. The move also overcame a big limitation of Google Earth and Enterprise Server. By using only the browser and making Facebook the co-registrar at Births, Deaths and Marriages, Globe 2.x linked the user back into the geometries of Queensland, “My Place”.
In Globe 2.x users can pluck curated geometries from the state’s datastore and make them their own. What’s more, and still in its infancy, users can start to transact with these geometries. For example, my father asked a question about a creek near where he grew up in the Fassifern Valley. Using Globe 2.x I was able to locate the creek, get my orientation to the creek just right, and pass this point of view on. This could be done without dissociating my identity from the Globe. Better still, the story, his ancestral home, ties into the jurisdiction where I belong. From citizen to user to citizen-user.
In Globe 2.x the government is prepared to cede control of their citizens' identities to Facebook / Google / Twitter. But in doing this another issue emerges. As the user plucks geometries from the stack, the link becomes severed. Over time, the citizen-user’s geometries will become stale as the original geometries are changed by the curator. But users will want to keep their geometries fresh. They’ll want geometry updates not only app updates. The future demand will be for the lifecycle of topographical features to be made explicit. Here again, we should take a cue from the Ordnance Survey. The OS uniquely identified every feature with a topographic identifier (TOID). Every phone box, road and ford has a revision history. Other jurisdictions will need to do something similar and make all their geometries uniquely addressable (stabilise change with a hash; think github).
On the Stack, states are starting to accept the off-shoring of their citizens' identities and finding new ways to link them back into the services they provide. For the purveyors of fine geometries, one way to do this is make users aware, and a part of, the vitality of their objects.